
IoT Solutions and OptiSave
IoT solutions make it easier to monitor and manage energy performance at sea.
For vessels using OptiSave, DESMICloud provides real-time access to operational data, giving crews and operators better visibility and faster decision-making. With DESMICloud, you can track performance over time, review historical data, and troubleshoot remotely when needed. This helps support stable operation, improved energy efficiency, and reduced downtime.
DESMICloud: Smart, connected, and proactive pump control, 24/7

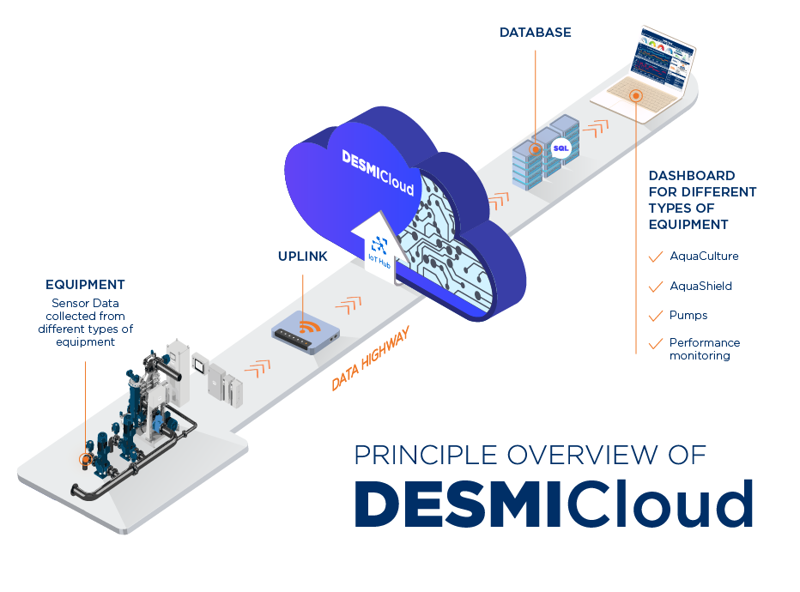
How DESMICloud works
Monitoring data for most solutions:
DESMICloud and DESMI dashboards provide the infrastructure to collect, transfer, and review operational data from DESMI flow technologies, including OptiSave.
All important data in one place
The DESMICloud solution facilitates continuous surveillance of all relevant sensor-based parameters such as:
- Pressure at inlet and discharge flange
- Flow
- Vibration level
- Media temperature
- Motor temperature
- Etc.
By collecting and processing this data, DESMICloud helps operators monitor system performance, improve efficiency, and detect deviations early. The local IoT box gathers sensor values and operational data, which are then transferred to the cloud for analysis, dashboard visualization, and alerts.
What this means for OptiSave:
For OptiSave users, this means better visibility into energy and system performance across the vessel. DESMICloud gathers and presents key operating data in one place, making it easier to track trends, identify issues early, and support more efficient operation.
With access to dashboards, alerts, and historical data, crews and operators can monitor savings, verify that the system is operating as intended, and ensure it is being used correctly rather than running unnecessarily in manual mode. This helps reduce operating costs while also supporting the documentation of environmental performance, which is becoming increasingly important for some types of vessels.
Examples of OptiSave Dashboards
The dashboard examples below show how IoT data can be transformed into clear operational insights across fleet and onboard systems. To clarify what the numbers on the dashboard mean, each metric is explained.
- The map: Showcases the location.
- Fuel type and fuel price: The Fuel type, the VLSFO, and fuel price, the 600 $, provide visibility into the fuel used by the selected vessels, while the fuel price is used for calculations in the Energy Table below.
- SFOC: This can be seen on the dashboard as the 209 and indicates how much power a vessel can generate from a given amount of fuel (measuring engine efficiency in g/kWh).
- The VFD Overview: This provides a new and more intuitive way to monitor system status, giving users a clearer overview of which units are operating and which are set to manual mode.
- Energy Table: The Table provides insight into the various components of the OptiSave system, showing their power consumption and CO₂ emissions.

OptiSave Dashboard continued
- LIVE/Historic Data: Below the Energy Table, shown on the above picture, the LIVE/Historic Data section provides insight into how the VFDs connected to the OptiSave system have operated over time. Different parameters can be selected depending on the user’s needs. In this example, kW and AMP are shown.
- Environmental temperature: This is another parameter intended to provide an indication of the conditions in which the system is operating.

DESMICloud Solution and Data Accesibility in Customer Scada System
All data can be transmitted to the DESMI cloud by LAN, WIFI, LoRaWAN, 3G/4G or whatever is available on the site.
The data, which is relevant in the daily operation, can be directed into the customer SCADA/Management System and can be used to monitor the efficiency and the “health” of the pumps along with other required parameters.
Benefits of the DESMICloud
- Access to DESMI's global network of certified experts to optimize operation and improve products based on data.
- Monitoring the devices and optimizing maintenance planning and component lifetime.
- Easy overview to reduce operational cost and minimize the number of service trips.
- Distinguish between failures that require immediate attentions vs planned maintenance.
- Possibilities to automate tasks (Alarm, Warning mail on limits).
- Eradicate root causes for failure.
- Periodic inspection for preventive maintenance.

